What is GIS?
GIS stands for Geographical Information Systems, which are computer-based systems used to assemble, store, manipulate, edit, display and analyse geographically referenced information and associated attributes.
In a GIS, all features composing the maps are coded and stored with coordinates describing their location, while attribute data (extra information associated to the map features) can be saved and manipulated using conventional methods, such as in database management systems. The ability to link these types of data opens exciting possibilities to analyse spatial distributions of processes over time or space.
Often, GIS is simply used to visualize characteristics about a landscape or environment.
- Attributes can be displayed as symbols on maps
- The appearance and size of these map symbols can vary depending on varying attribute values
- More complex information can be linked to maps through the use of, for example, diagrams and charts
A GIS can also be a tool for analysing data, optimising activities, performing risk analyses and test different scenarios. Among other functions, a GIS can:
- Find the shortest route between 2 points on a road map
- Estimate and analyse the potential clientele within a given distance of a new boutique, using geo-referenced population data
- Estimate the number of potential clients within a 5 minute driving time of a particular boutique
- Locate the optimal location for a new road by combining real estate, soil, land use and slope data
- Model environmental consequences of a given discharge by using, for example, climate and soil data
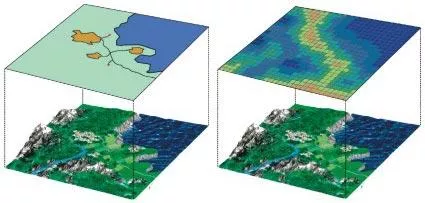
The map information in a GIS is presented in different layers, where each layer represents, for example, roads, rivers, forests, built-up areas or real estate properties (see Figure 1 below).
These layers can easily be manipulated and updated, and important information can be extracted based on their location or attributes (for example, how many properties have an area less than one hectare and/or a well deeper than 5 meters). Different layers can also be combined to analyse and generate new information or layers (for example, how many properties have an area less than one hectare and are located less than 3km away from an existing road, have a well deeper than 5 meters and are located on sandy soils).
In a GIS, it is also possible to link information about a geographical feature from one database to another database, which also contains information about the same feature. This facilitates the updating and use of specific databases, which may have their origin at different sites.
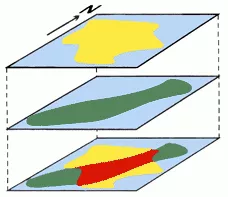
County A
Wooden area
Wooden area in County A
Figure 1: An example of an overlay operation of two geo-coded data layers to get a third layer that contains information from both. The resulting layer in the example can be used to calculate the area of forest within and without the municipal district A.